Methods
Disclaimer
Back to TopThis site contains data and features in geographical representations that are not legal representations. The accuracy of the data may change depending on scale adjustments.
The California Department of Parks and Recreation Office of Grants and Local Services (OGALS) presents the information on this website as a service to the public. Every effort has been made to ensure the information is accurate. OGALS makes no warranty or guarantee concerning the completeness, accuracy, or reliability of the content. Assessing accuracy and reliability of this information is the sole responsibility of the user and data shall be used and relied upon only at the risk of the user.
Data Definitions
Back to TopCensus Block — A census block is the smallest geographic unit used by the US Census Bureau for the tabulation of data. Multiple blocks make up one census block-group.
Census Block Group — A census block-group averages 1,500 residents and is the next largest unit after a block, and smaller than a tract. Block-group is the smallest geography for which the bureau publishes data on poverty, median household income, and other sample data attributes.
Census Tract — Census tracts average 4,000 residents and are a larger unit than a census block-group.
No population areas — Census blocks with no population, per the Decennial Census (P1)
Parks — Open space land available for the general public, it includes a formal recreation destination or facility. See the 2015 SCORP, "Understanding park and Open Space Data", for more information about what is and is not counted as open space recreation land for the purpose of these SCORP tools.
Parks and park acres are based on best available source information but may not always contain exact boundaries or all parks in specific locations. Parks are further defined in this report: https://parksforcalifornia.org/park_equity#parks_data
Park access — A calculation of the population living in close proximity to a park, using two approaches:
- A half mile zone surrounds all parks. The population living within a half mile of a park is counted as being in close proximity of a park.
- Park acreage per 1,000 residents within a census tract.
Parks and park acres are based on best available source information but may not always contain exact boundaries or all parks in specific locations. Parks are further defined in this report: https://parksforcalifornia.org/park_equity#parks_data
For more information about the use of these standards, see the 2015 SCORP, "California Develops New Tools to Assess Park Need".
Population — Block and block-group population from Decennial Census (P1), American Community Survey 5-year estimates (B01001_001E)
Community FactFinder 2025 version: American Community Survey 2019-2023 5-year estimates (B01001_001E), block and block-group population from Census 2020 (P1).
Park Access Tool 2020 version: American Community Survey 2014-18 5-year estimates (B01001_001E), block and block-group population from Census 2010 (P1). This tool is updated for California's SCORP every five years. The next update will be released in 2024/25 to inform California's 2026-2030 SCORP.
Disadvantaged Community — Census block-groups with a Median HouseHold Income (MHHI) less than 80% of the California MHHI. The threshold is derived from American Community Survey 5-year estimates at the block-group geographic level, per the California Public Resources Code (PRC), Section 75005(g).
Severely Disadvantaged Community — Census block-groups with a Median Household Income (MHHI) less than 60% of the California MHHI. The threshold is derived from American Community Survey 5-year estimates at the block-group geographic level, per the California Public Resources Code (PRC), Section 75005(g).
Data Sources
Back to TopCensus Blocks — 2010 and 2020 Decennial Census, 2010 and 2020 TIGER files
Census Block-Group, Census Tract — Block-group population estimates from the 2010 and 2020 Decennial Census, American Community Survey, and TIGER.
Community FactFinder 2025 version: American Community Survey 2019-2023 5-year estimates (B01001_001E), block and block-group population from Census 2020 (P1).
Park Access Tool 2020 version: American Community Survey 2014-18 5-year estimates (B01001_001E), block and block-group population from Census 2010 (P1). This tool is updated every five years. The next update will be released in 2024/25 to inform California's 2026-2030 SCORP.
English Learner data— 2023-2024 school year, California Department of Education "elsch23.txt" 7MB Posted 16-May-2024; Data field: TOTAL_EL
Free or reduced price meals— 2023-2024 school year, California Department of Education "Unduplicated Student Poverty - Free or Reduced-Price Meals Data 2023-24" 2MB Posted 16-May-2024; Data fields: Enrollment (K-12), FRPM Count (K-12), Percent (%) Eligible FRPM (K-12)
Parks — California Protected Areas Database (CPAD) adjusted for California State Parks
Community FactFinder 2025 version: CPAD 2024b (12/2024) adjusted for California Department of Parks and Recreation.
Park Access Tool 2020 version: CPAD 2019b (11/2019) adjusted for California Department of Parks and Recreation. This tool is updated for California's SCORP every five years. The next update will be released in 2024/25 to inform California's 2026-2030 SCORP.
Schools— California School Campus Database (CSCD) 2021 and the California Department of Education "Public Schools and Districts", 11/2020
Community FactFinder
Back to TopThe Community FactFinder (CFF) tool runs demographic summaries for a half mile radius of any point drawn in California. The demographic data is from the most current release of the Census Bureau's American Community 5-year survey. To operate, the program draws a half mile circle around the selected point. It then finds all of the block-groups that intersect with that radius. The intersected block-groups are split so that only the portion of the block-group polygons that are inside of the polygon are retained. While splitting the block-groups, the program assumes and equal distribution of population. Therefore, if only 1/3 of the block-group is inside of the radius, only 1/3 of the population is counted. The resulting full and partial block-groups are then summarized and reported.
While this method produces accurate results in urban areas, rural areas with small pocket populations can be improved. To improve rural area calculations, one needs to distribute the block-group data proportionally down to the census block level. This is done to avoid large geographic block-groups with a small populated portion from being over distributed. For example, a block-group covers 35 square miles with a population of 1,000. Inside that block-group there is one contiguous 5 square mile cluster with 900 people, the other 100 people are spread out over the remaining 30 square miles. By breaking the block-group geometry down to blocks one can more accurately place the population, and thus the park acreage per thousand residents and other attributes.
Each time a circle is identified the CFF tool reviews the block-groups overlapped by the circle. If any of the block-groups are classified as rural, the tool uses the block level allocated estimates for the attribute reporting. Circles do not mix block-group and block input methods – this avoids possible edge matching issues.
Overview of Methods and Data
Variables:
BG_ID = Block group ID (standard Census format)
SA_ac = Total acres in service area (sum of all BG_SA_ac values)
BG_ac = Acres of the full block-group
BG_SA_ac = Acres of block-group within the area
TotPop = Total population
PCI = Per capita income
Population is calculated as:
Population of Service Area = ∑ of [TotPop] *[BG_SA_ac]/[BG_ac]
Per Capita Income is calculated as:
Per Capita Income, Weighted Average = ∑ of ([BG_SA_ac] * [PCI])/ [SA_ac]
Sample:
| Block Group ID | Block Group Acres | Acres of block-group within the area (BG_SA_ac) | Total Population | Per Capita Income (PCI) | Population of Service Area | BG_SA_ac * PCI |
|---|---|---|---|---|---|---|
| 1 | 2.5 | 2.5 | 100 | $50,000 | 100 | $125,000 |
| 2 | 3 | 1.5 | 50 | $100,000 | 25 | $150,000 |
The area has a total of 4 "Acres of block-group within the area (BG_SA_ac)", a "Population of Service Area" of 125, resulting in a weighted Per Capita Income of $68,750.
Notes:
- Any attributes based on a count (people in poverty, race/ethnicity, etc.) are calculated with the same formula used for total population.
- Any attributes based on a value (median household income, etc.) are calculated with the same formula used for per capita income.
- The ACS reports a margin of error (MOE) for each statistic. Users should review and become familiar with the MOE. The Census Bureau provides a variety of resources online.
- The MOE does not reflect the error inherent in assuming equal distribution of an attribute across a block-group, or the error inherent in using a weighted average.
The map contains layers for Disadvantaged and Severely Disadvantaged communities. The thresholds are derived from the American Community Survey 5-year estimates at the block group geographic level and the California State Median Household Income. Per the California Public Resources Code (PRC), Section 75005(g).
Community FactFinder — Outdoor Equity Program (OEP)
Back to TopIn addition to the statistics shown on the standard CFF application, the OEP site includes data on free/reduced meals and English language learners. Both data sets are from DataQuest, California Department of Education from the 2023-2024 school year.
School data is fetched for the nearest elementary, middle/junior/intermediate, and high school to the location the pin is dropped. The tool searches until it finds the nearest combination of three schools: one elementary, one middle/junior/intermediate, and one high school.
California schools are diverse in the types of schools and grade levels offered. For consistency, the OEP tool only includes traditional schools. Charter and magnet schools are not included.
Example 1
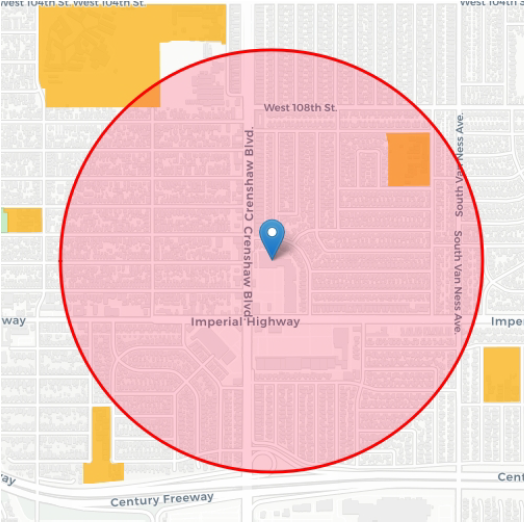
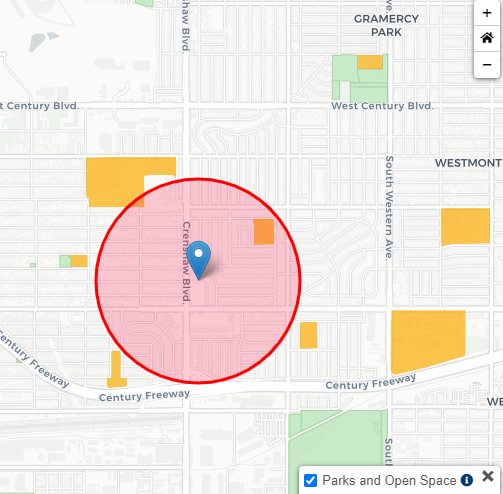
California State Parks - Outdoor Equity Program Report (Project ID: 104916)
1. A pin is dropped at: 33.93296349,-118.32550049

2. The OEP tool generates a table showing the distance to the nearest schools. The tool searches beyond the half-mile circle when necessary to obtain a school of each level.

| Dist (ft) | School Name | Level | ELM | MID | HS | Grades | Students Enrolled | English Learners | Free / Reduced Meals |
|---|---|---|---|---|---|---|---|---|---|
| 1,926 | Century Park Elementary | Elementary | Yes | No | No | K-5 | 277 | 64 | 230 |
| 2,404 | Morningside High | High School | No | No | Yes | 12-Sep | 678 | 182 | 440 |
| 2,615 | Bennett/Kew TK-6 Elementary | Elementary | Yes | No | No | K-7 | 360 | 103 | 338 |
| 2,794 | Worthington Elementary | Elementary | Yes | No | No | K-6 | 358 | 149 | 324 |
| 2,826 | Woodworth-Monroe K-8 Academy | Elementary - Inter./Middle/Junior High Combination | Yes | Yes | No | K-8 | 693 | 240 | 575 |
| 2,894 | Cimarron Avenue Elementary | Elementary | Yes | No | No | K-5 | 286 | 26 | 225 |
| 5,242 | Middle College High | High School | No | No | Yes | 12-Sep | 397 | 5 | 359 |
| 6,559 | Boys Academic Leadership Academy | Intermediate/Middle/Junior High | No | Yes | No | 10-Jun | 106 | 11 | 81 |
| 7,017 | Manhattan Place Elementary | Elementary | Yes | No | No | K-5 | 280 | 56 | 268 |
- Elementary (Century Park Elementary)
- Intermediate/Middle/Junior High (Woodworth-Monroe Academy)
- High School (Morningside High)
| Dist (ft) | School Name | Level | ELM | MID | HS | Grades | Students Enrolled | English Learners | Free/ Reduced Meals |
|---|---|---|---|---|---|---|---|---|---|
| 1,926 | Century Park Elementary | Elementary | Yes | No | No | K-5 | 277 | 64 | 230 |
| 2,404 | Morningside High | High School | No | No | Yes | 12-Sep | 678 | 182 | 440 |
| 2,826 | Woodworth-Monroe Academy | Elementary - Inter./Middle/Junior High Combination | Yes | Yes | No | K-8 | 693 | 240 | 575 |
4. School Calculations:
Free/Reduced Priced Meals:- Sum of Students Enrolled (1,648)
- Sum of Free/Reduced Meals (1,245)
- ((Sum of Free/Reduced Meals) / (Sum of Students Enrolled)) *100
((1,245) / (1,648)) *100 = 75.5%
- Sum of Students Enrolled (1,648)
- Sum of English Learners (486)
- ((Sum of English Learners) / (Sum of Students Enrolled)) * 100
((486) / (1,648)) *100 = 29.5%
Example 2
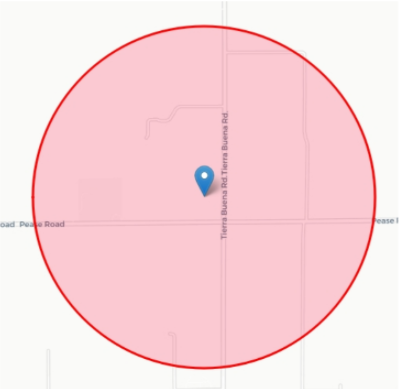
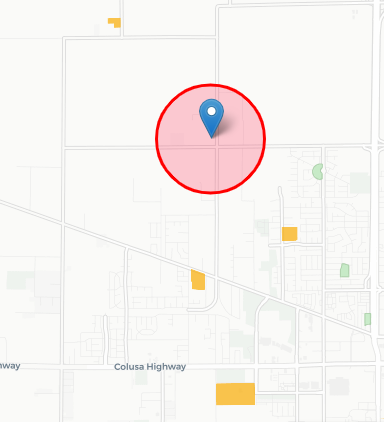
California State Parks - Outdoor Equity Program Report (Project ID: 104922)
1. A pin is dropped at: 39.17172711,-121.66337013

2. The OEP tool generates a table showing the distance to the nearest schools. The tool searches beyond the half-mile circle when necessary to obtain a school of each level.

| Dist (ft) | School Name | Level | ELM | MID | HS | Grades | Students Enrolled | English Learners | Free/ Reduced Meals |
|---|---|---|---|---|---|---|---|---|---|
| 6,443 | Butte Vista Elementary | EL - MID | Yes | Yes | No | K-8 | 939 | 132 | 494 |
| 6,671 | Tierra Buena Elementary | EL - MID | Yes | Yes | No | K-8 | 724 | 105 | 474 |
| 7,011 | Nuestro Elementary | EL - MID | Yes | Yes | No | K-8 | 190 | 8 | 91 |
| 12,804 | River Valley High | HS | No | No | Yes | 12-Sep | 1896 | 181 | 1388 |
- Elementary (Butte Vista Elementary)
- Intermediate/Middle/Junior High (Butte Vista Elementary)
- High School (River Valley High)
| Dist (ft) | School Name | Level | ELM | MID | HS | Grades | Students Enrolled | English Learners | Free/ Reduced Meals |
|---|---|---|---|---|---|---|---|---|---|
| 6,443 | Butte Vista Elementary | EL - MID | Yes | Yes | No | K-8 | 939 | 132 | 494 |
| 12,804 | River Valley High | HS | No | No | Yes | 12-Sep | 1896 | 181 | 1388 |
4. School Calculations:
Free/Reduced Priced Meals:- Sum of Students Enrolled (2,835)
- Sum of Free/Reduced Meals (1,882)
- ((Sum of Free/Reduced Meals) / (Sum of Students Enrolled)) *100
((1,882) / (2,835)) *100 = 66.4%
- Sum of Students Enrolled (2,835)
- Sum of English Learners (313)
- ((Sum of English Learners) / (Sum of Students Enrolled)) * 100
((313) / (2,835)) *100 = 11.0%
Community FactFinder — Per Capita Income (PCI) Tool
Back to TopFor Counties and Regional Park Districts, the tool uses a one-mile radius to calculate whether there is a Severely Disadvantaged Community near the proposed project location.
For all Other Agencies, the tool uses a half-mile radius to calculate whether there is a Severely Disadvantaged Community near the proposed project location.
Park Access Tool: Half Mile Park Access Methodology
Back to TopSummary
With GIS tools, we created a half mile zone around all statewide parks. Using the most recent American Community Survey block-group population estimates, and an assumption of equal population distribution within block-groups, we then analyzed how many of California's 38 million residents live within, or outside of, the half mile zones surrounding all statewide parks.
Results: 21% of Californians, nearly 9 million people, live over a half mile from a park or open space. See an interactive map of results for the state, cities, counties, and districts on the Park Access Tool page
Overview of Methods and Data
Methods used to determine the population with or without close-to-home park access in California:
Classify all areas of the state as park, park access, or no park access:
- Define "parks", as the CFF version of CPAD [defined above]
- Buffer all parks by 1/2 mile to define "park access areas"
- Define all non-park, and those areas outside the half mile buffer, as "no park access"
- Erase areas: water, Department of Defense lands, block-groups with no population
Population Estimates:
- Download the most recent block-group population figures (ACS 5-yr estimates) when a new SCORP is produced every five years
- Erase the portion of block-groups that are water/bay
- Assuming equal distribution of populations in block-groups, determine the number of people living in the three classifications:
- Intersect the access types with the remaining block-groups
- Calculate the percent of each block-group in each of the access types
- Using the results of b., apply the same percent of the population to that access type. EXAMPLE:
- Blockgroup acres: 500
- Park acres in block-group: 25
- Park access acres in block-group: 100
- No park access acres in block-group: 375
- Blockgroup population: 100
- In park access areas: 25
- In no park access areas: 75
Park Access Tool: Acres of Park per Thousand Residents
Back to TopSummary
California State Parks chose census tracts as the area against which to assess the amount of existing parkland in comparison to the 3 acres/1,000 population metric. Census tracts vary in population size, but average approximately 4,000 persons. Note that in some situations, additional parkland may lie at the edge of (or very close to) a particular tract, a condition not measured by this analysis.
Results: 61% of Californians live in census tracts with less than 3 acres/1,000 residents. See an interactive map of results for the state, cities, counties, and districts on the Park Access Tool page
Overview of Methods and Data
Methods used to determine the park acres per thousand residents, by census tract:
- Intersect the census tracts with parks and open space
- Recalculate the park acres for all park pieces cut up to tracts
- Summary the total acres of park and open space in each tract
- Calculate park acres per thousand residents for all tracts with population (tracts with no population were not calculated)
Park Access Tool Data was updated to inform California’s 2021-2025 SCORP. The next update will be released in 2024/25 to inform California's 2026-2030 SCORP.
Vulnerability Commmunity Platform (VCP) Climate Change Layers
Back to TopSummary
We currently display five climate change layers from the Vulnerable Communities Platform (VCP) in the Community FactFinder mapping application to help understand potential climate change impacts at project locations. These layers include: extreme heat, wildfire, sea level rise, drought, and flood. Each layer was downloaded and minimally processed in desktop GIS prior to being imported to the Parks For California database. For each layer, we selected all areas with "High" ranks and merged these into a single layer to highlight the most at-risk communities. For additional details on the individual layers and data sources refer to the VCP Methods Report linked from the VCP website.
Overview of Layers and Data Sources
- VCP Extreme Heat Vulnerability Rank
- Source: Vulnerable Communities Platform
- Field:
ExHeat_H_Rank_pre - Values displayed:
High - VCP Fire Hazard Rank
- Source: Vulnerable Communities Platform
- Field:
Wildfire_H_Rank_pre - Values displayed:
High - VCP Sea Level Rise Rank
- Source: Vulnerable Communities Platform
- Field:
SLR_H_Rank_pre - Values displayed:
High - VCP Drought Vulnerability Rank
- Source: Vulnerable Communities Platform
- Field:
Drought_H_Rank_pre - Values displayed:
High - VCP Flood Vulnerability Rank
- Source: Vulnerable Communities Platform
- Field:
Flood_H_Rank_pre - Values displayed:
High
GIS processing and analysis was conducted using ESRI desktop software and extensions.
